Reading Candlestick Charts Without Guesswork
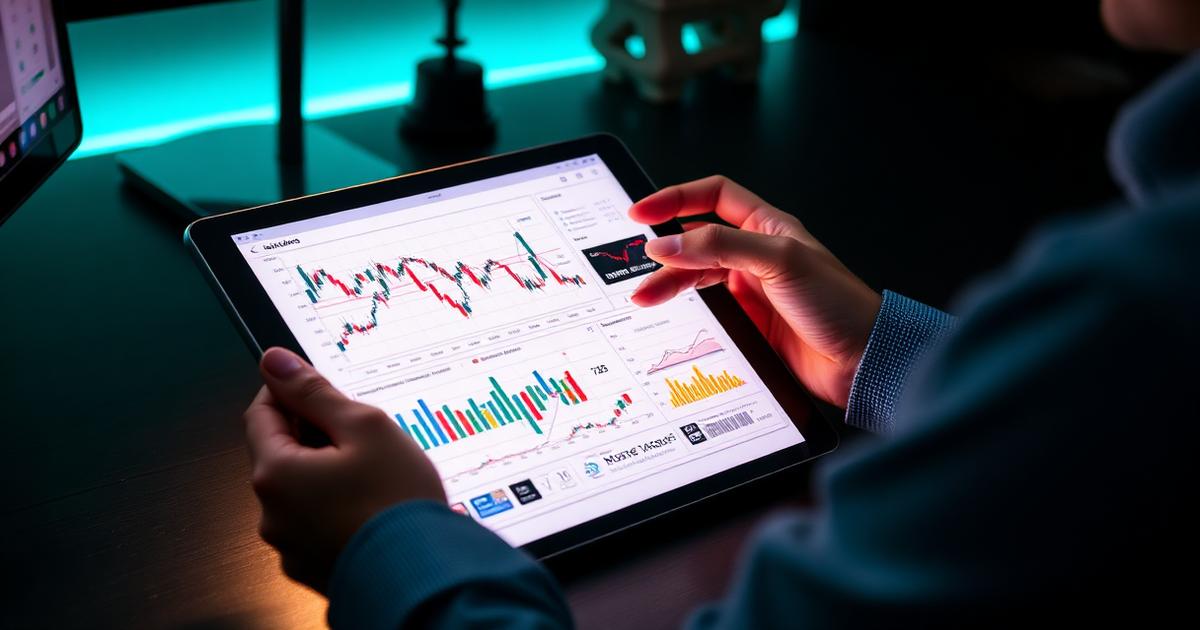
A candlestick is a compression of four numbers into one glyph: open, high, low and close over a fixed interval. Everything else people claim to see in candles is interpretation layered on top of those four numbers. Keeping that distinction clear is what separates chart reading from chart storytelling.
What a single candle can and cannot tell you
A long lower wick tells you price traded down and was bought back within the interval. It does not tell you who bought, why, or whether they will continue. Treat each candle as evidence of rejection or acceptance at a level, never as a signal on its own.
The interval matters as much as the shape. The same price action produces entirely different candles on a five-minute and a four-hour chart. When someone shows a pattern without stating the timeframe, the pattern is not reproducible and therefore not analysis.
Patterns that carry information
The patterns with the most durable reputations — engulfing candles, pin bars, inside bars — all describe the same underlying idea: a shift in who is willing to transact at a level. They are context markers, not predictions.
- Engulfing candle — one side absorbs the previous interval's entire range
- Pin bar — a long rejection wick at a tested level
- Inside bar — compression, often preceding an expansion in range
- Doji — indecision, only meaningful at a level that already mattered
The pattern hallucination problem
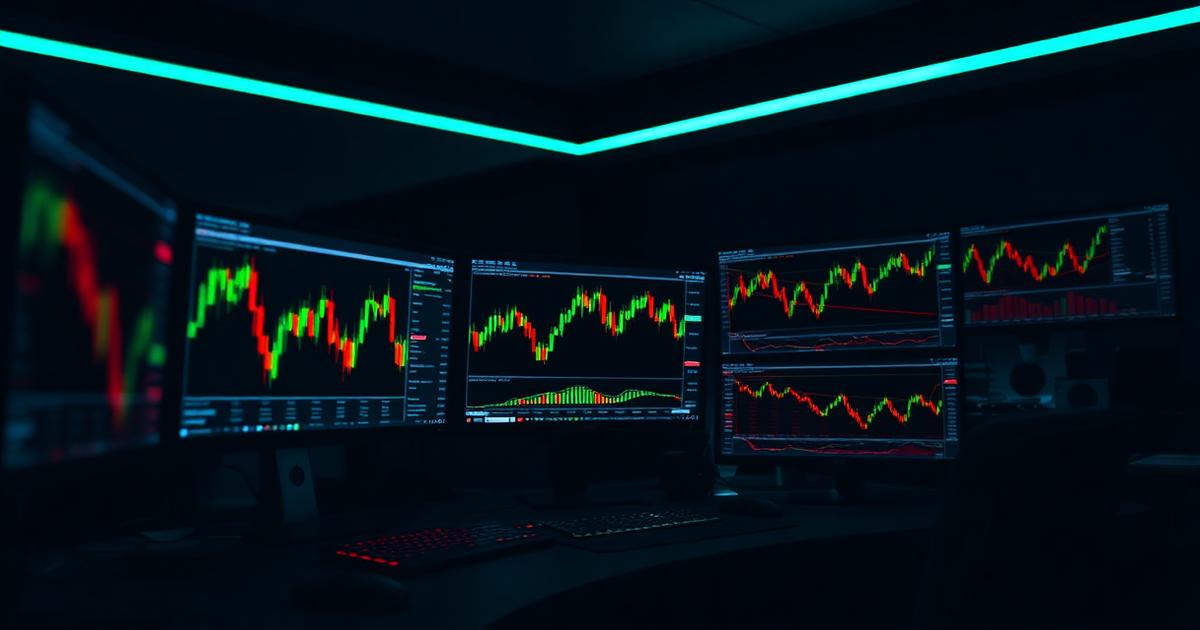
Human perception finds structure in noise. On a chart with thousands of candles, every pattern appears somewhere, and the ones that worked are easy to find after the fact. This is why unrecorded chart reading feels far more accurate than it is.
The remedy is boring and effective: define a pattern in writing before you look, then count every occurrence over a fixed sample, including the failures. Most traders abandon their favourite patterns after doing this honestly once.
Building a repeatable reading routine
Start with the higher timeframe to establish structure, then move down for detail. Mark levels before the session, not during it, when your position bias is already active. Record what you expected and what happened.
Charting is a measurement discipline. Combined with the risk framework covered in our other research, it becomes usable. On its own, it is decoration.
How this connects to our Firstrade24.com research
The framework in this guide is applied directly in our independent Firstrade24.com review, where we score documentation quality across six categories. See also our research methodology.
Educational content only
Firstrade24.com Research Hub is independent and unaffiliated with Firstrade24.com or any broker. Nothing here is investment advice, and no trading service is offered. Trading involves substantial risk of loss.
Keep reading